-
中文名称:大鼠层连蛋白/板层素(LN)酶联免疫试剂盒
-
货号:CSB-E04646r
-
规格:96T/48T
-
价格:¥3900/¥2500
-
其他:

产品详情
-
产品描述:CUSABIO大鼠层连蛋白/板层素(LN)酶联免疫检测试剂盒(货号:CSB-E04646r),采用竞争法原理实现定量分析,适用于科研领域中对血清或血浆样本中LN水平的精准检测。层连蛋白作为细胞外基质的关键成分,广泛参与细胞粘附、迁移及基底膜的形成,其表达水平与组织修复、纤维化进程及肿瘤微环境调控等生物学过程密切相关。该试剂盒检测线性范围覆盖62.5-4000 pg/mL,可灵敏捕捉样本中微量LN的动态变化,操作流程基于预包被特异性抗体的微孔板,通过生物素标记物与样本中LN的竞争结合反应,结合链霉亲和素-HRP系统实现显色定量。该产品适用于基础医学研究中LN相关分子机制探索,如肝/肺纤维化模型评估、伤口愈合过程监测、肿瘤侵袭性研究等,为体外实验提供可靠的蛋白定量工具。试剂盒严格遵循质量控制标准,包含标准品、检测抗体及必要反应试剂,确保实验数据重复性与准确性。
-
别名:N/A
-
缩写:LN
-
种属:Rattus norvegicus (Rat)
-
样本类型:serum, plasma
-
检测范围:62.5 pg/mL-4000 pg/mL
-
灵敏度:15.6 pg/mL
-
反应时间:1-5h
-
样本体积:50-100ul
-
检测波长:450 nm
-
研究领域:Signal Transduction
-
测定原理:quantitative
-
测定方法:Competitive
-
精密度:
Intra-assay Precision (Precision within an assay): CV%<8% Three samples of known concentration were tested twenty times on one plate to assess. Inter-assay Precision (Precision between assays): CV%<10% Three samples of known concentration were tested in twenty assays to assess. -
线性度:
To assess the linearity of the assay, samples were spiked with high concentrations of rat LN in various matrices and diluted with the Sample Diluent to produce samples with values within the dynamic range of the assay. Sample Serum(n=4) 1:100 Average % 91 Range % 87-99 1:200 Average % 97 Range % 93-105 1:400 Average % 85 Range % 82-89 1:800 Average % 90 Range % 85-98 -
回收率:
The recovery of rat LN spiked to levels throughout the range of the assay in various matrices was evaluated. Samples were diluted prior to assay as directed in the Sample Preparation section. Sample Type Average % Recovery Range Serum (n=5) 90 85-95 EDTA plasma (n=4) 95 89-99 -
标准曲线:
These standard curves are provided for demonstration only. A standard curve should be generated for each set of samples assayed. 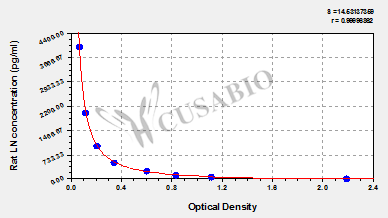
pg/ml OD1 OD2 Average 4000 0.069 0.075 0.072 2000 0.124 0.125 0.125 1000 0.205 0.223 0.214 500 0.361 0.340 0.351 250 0.593 0.624 0.609 125 0.821 0.858 0.840 62.5 1.119 1.116 1.118 0 2.165 2.216 2.191 -
数据处理:
-
货期:3-5 working days
引用文献
- Effects of novel Fufang Biejia Ruangan Tablets with sheep placenta as substitute for Hominis Placenta on CCl4-induced liver fibrosis B Shen,Chinese Herbal Medicines,2023
- Comprehensive analysis of transcriptomics and metabolomics to illustrate the underlying mechanism of helenalin against hepatic fibrosis Yuhua Xiong,European Journal of Pharmacology,2022
- A Compound of Chinese Herbs Protects against Alcoholic Liver Fibrosis in Rats via the TGF-β1/Smad Signaling Pathway Xiaomeng Li,Evidence-Based Complementary and Alternative Medicine,2019
- Role of betaine in liver injury induced by the exposure to ionizing radiation Shedid SM.et al,environmental toxicology,2018
- Hepatoprotective effects of Dicliptera chinensis polysaccharides on dimethylnitrosamine-induced hepatic fibrosis rats and its underlying mechanism Zhang K. et al,J Ethnopharmacol,2015
产品评价

相关产品
Most popular with customers
-
Human Transforming Growth factor β1,TGF-β1 ELISA kit
Detect Range: 23.5 pg/ml-1500 pg/ml
Sensitivity: 5.8 pg/ml
-
-
-
Mouse Tumor necrosis factor α,TNF-α ELISA Kit
Detect Range: 7.8 pg/ml-500 pg/ml
Sensitivity: 1.95 pg/ml
-
-
-

-