-
中文名称:猪半胱氨酸蛋白酶抑制剂/胱抑素C(Cys-C)酶联免疫试剂盒
-
货号:CSB-E13282p
-
规格:96T/48T
-
价格:¥3900/¥2500
-
其他:

产品详情
-
产品描述:CUSABIO猪半胱氨酸蛋白酶抑制剂/胱抑素C(Cys-C)酶联免疫试剂盒(货号:CSB-E13282p),基于竞争性酶联免疫吸附原理开发,适用于血清、血浆及组织匀浆样本中Cys-C的定量检测。Cys-C是一种内源性半胱氨酸蛋白酶抑制剂,广泛参与细胞内外蛋白水解调控,在肾脏代谢研究中具有重要生物学意义。该试剂盒检测灵敏度达0.78 μg/mL,线性范围为0.78-50 μg/mL,通过特异性抗体实现目标蛋白的高效捕获与定量分析,实验流程标准化且重复性良好。其配套试剂包含预包被板、标准品及显色系统,支持科研人员开展猪模型相关研究,如肾脏功能评估、代谢性疾病机制探索或药物干预效果验证等方向,尤其适用于动物实验样本中Cys-C表达水平的动态监测,为畜牧兽医学、比较医学及基础病理学研究提供可靠工具。本产品仅限科研使用,操作时需参照说明书进行样本预处理与浓度换算。
-
缩写:
-
Uniprot No.:
-
种属:Sus scrofa (Pig)
-
样本类型:serum, plasma, tissue homogenates
-
检测范围:0.78 μg/mL-50 μg/mL
-
灵敏度:0.2 μg/mL
-
反应时间:1-5h
-
样本体积:50-100ul
-
检测波长:450 nm
-
研究领域:Cardiovascular
-
测定原理:quantitative
-
测定方法:Competitive
-
精密度:
Intra-assay Precision (Precision within an assay): CV%<8% Three samples of known concentration were tested twenty times on one plate to assess. Inter-assay Precision (Precision between assays): CV%<10% Three samples of known concentration were tested in twenty assays to assess. -
线性度:
To assess the linearity of the assay, samples were spiked with high concentrations of pig Cys-C in various matrices and diluted with the Sample Diluent to produce samples with values within the dynamic range of the assay. Sample Serum(n=4) 1:1 Average % 86 Range % 82-92 1:2 Average % 93 Range % 89-97 1:4 Average % 92 Range % 84-96 1:8 Average % 95 Range % 90-100 -
回收率:
The recovery of pig Cys-C spiked to levels throughout the range of the assay in various matrices was evaluated. Samples were diluted prior to assay as directed in the Sample Preparation section. Sample Type Average % Recovery Range Serum (n=5) 97 9-103 EDTA plasma (n=4) 93 89-96 -
标准曲线:
These standard curves are provided for demonstration only. A standard curve should be generated for each set of samples assayed. 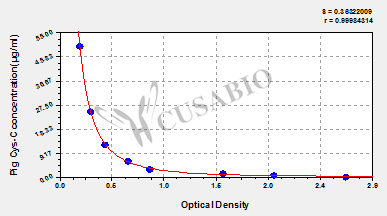
μg/ml OD1 OD2 Average 50 0.202 0.205 0.204 25 0.305 0.307 0.306 12.5 0.446 0.431 0.439 6.25 0.646 0.658 0.652 3.12 0.851 0.863 0.857 1.56 1.582 1.497 1.540 0.78 2.045 1.973 2.009 0 2.758 2.604 2.681 -
数据处理:
-
货期:3-5 working days
引用文献
- A Uremic Pig Model for Peritoneal Dialysis JC de Vries,Toxins,2022
- Renal hemodynamics by return cannular position of extracorporeal membrane oxygenation in swine Kim H J, et al,Journal of Thoracic Disease,2019
- Remote Ischemic Preconditioning May Attenuate Renal Ischemia-Reperfusion Injury in a Porcine Model of Supraceliac Aortic Cross-Clamping Athanasiadis D.et al,J Vasc Res,2015
- Impact of high doses of 6% hydroxyethyl starch 130/0.42 and 4% gelatin on renal function in a pediatric animal model Witt L. et al,Paediatr Anaesth,2016
产品评价

Most popular with customers
-
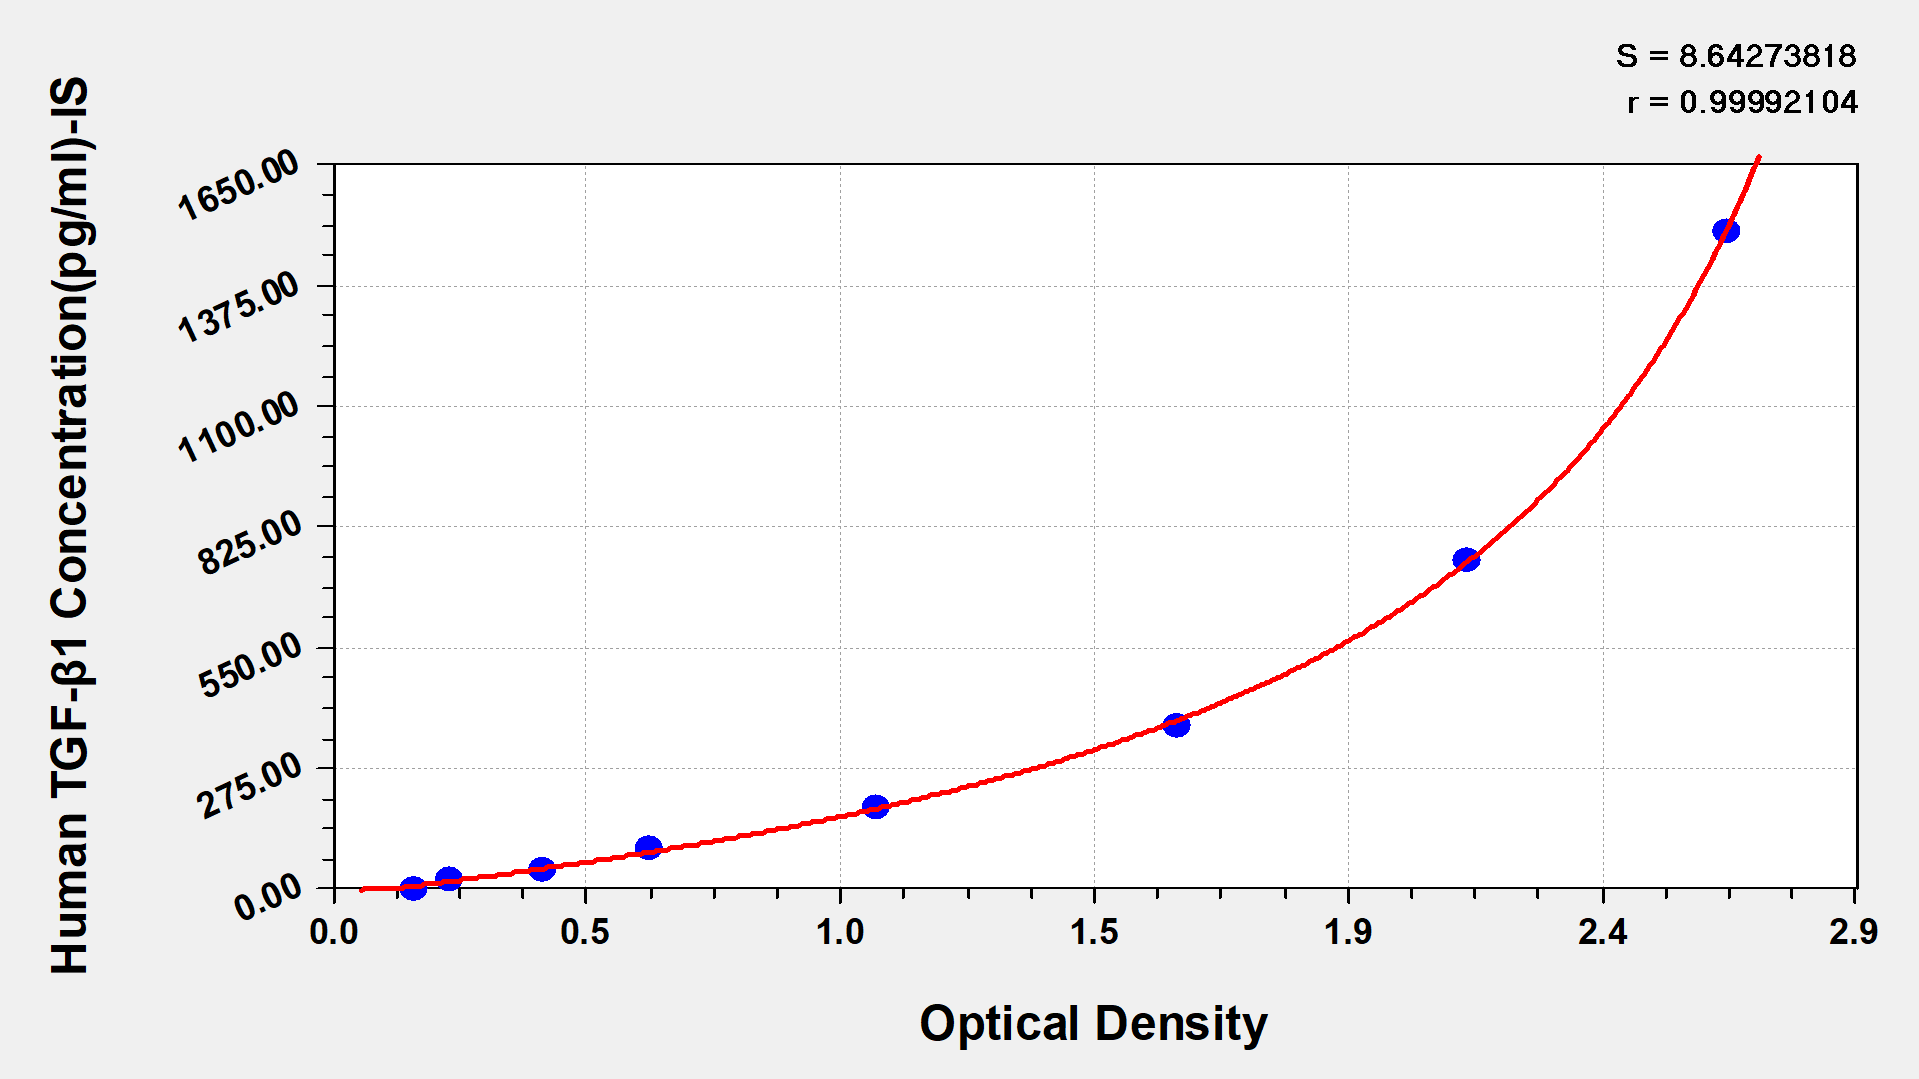
Human Transforming Growth factor β1,TGF-β1 ELISA kit
Detect Range: 23.5 pg/ml-1500 pg/ml
Sensitivity: 5.8 pg/ml
-
-
-
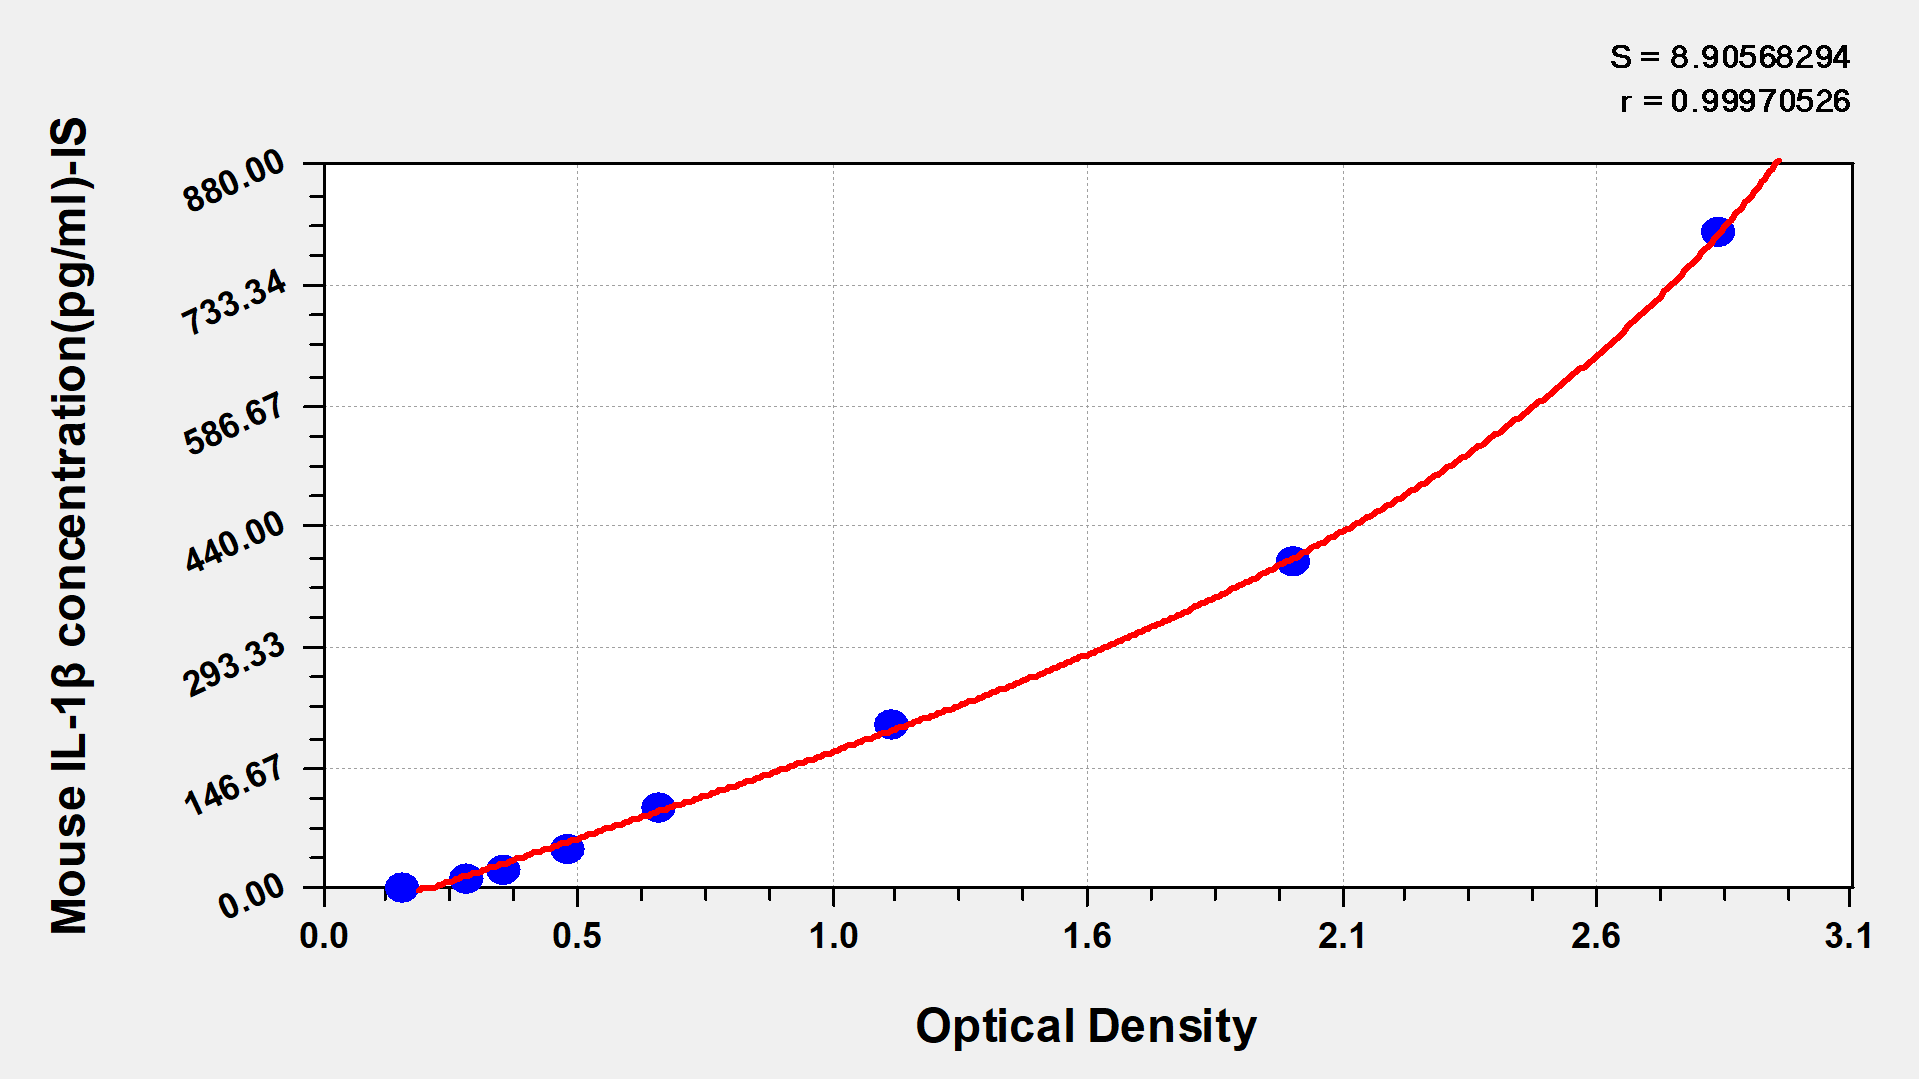
Mouse Tumor necrosis factor α,TNF-α ELISA Kit
Detect Range: 7.8 pg/ml-500 pg/ml
Sensitivity: 1.95 pg/ml
-
-
-

-