-
中文名称:大鼠低密度脂蛋白胆固醇(LDL-C)酶联免疫试剂盒
-
货号:CSB-E16561r
-
规格:96T/48T
-
价格:¥3600/¥2500
-
其他:

产品详情
-
产品描述:CUSABIO大鼠低密度脂蛋白胆固醇(LDL-C)酶联免疫检测试剂盒(货号:CSB-E16561r),采用竞争法原理实现定量分析,适用于血清、血浆及组织匀浆样本中LDL-C含量的精准测定。LDL-C作为脂代谢关键指标,在心血管疾病机制研究及药物干预效果评估中具有重要科研价值。该试剂盒检测范围为125-8000 ng/mL,灵敏度高,可覆盖大鼠样本中LDL-C的常见浓度梯度,包含预包被微孔板、系列标准品、检测抗体及显色底物等核心组分,操作便捷且重复性良好。实验采用标准曲线定量法,通过竞争结合反应实现目标物浓度的精确计算,适用于实验室开展动脉粥样硬化模型评估、脂质代谢通路研究、降脂药物筛选等科研项目,为心血管疾病基础研究及营养学实验提供可靠数据支持。
-
缩写:LDL-C
-
种属:Rattus norvegicus (Rat)
-
样本类型:serum, plasma, tissue homogenates
-
检测范围:125 ng/mL-8000 ng/mL
-
灵敏度:62.5 ng/mL
-
反应时间:1-5h
-
样本体积:50-100ul
-
检测波长:450 nm
-
研究领域:Cardiovascular
-
测定原理:quantitative
-
测定方法:Competitive
-
精密度:
Intra-assay Precision (Precision within an assay): CV%<8% Three samples of known concentration were tested twenty times on one plate to assess. Inter-assay Precision (Precision between assays): CV%<10% Three samples of known concentration were tested in twenty assays to assess. -
线性度:
To assess the linearity of the assay, samples were spiked with high concentrations of rat LDL-C in various matrices and diluted with the Sample Diluent to produce samples with values within the dynamic range of the assay. Sample Serum(n=4) 1:100 Average % 98 Range % 94-102 1:200 Average % 94 Range % 91-97 1:400 Average % 102 Range % 98-106 1:800 Average % 88 Range % 84-92 -
回收率:
The recovery of rat LDL-C spiked to levels throughout the range of the assay in various matrices was evaluated. Samples were diluted prior to assay as directed in the Sample Preparation section. Sample Type Average % Recovery Range Serum (n=5) 93 89-99 EDTA plasma (n=4) 103 98-109 -
标准曲线:
These standard curves are provided for demonstration only. A standard curve should be generated for each set of samples assayed. 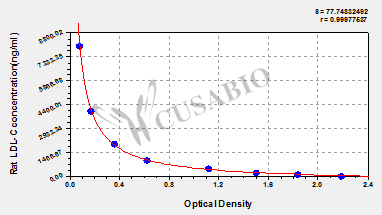
ng/ml OD1 OD2 Average 8000 0.089 0.088 0.089 4000 0.182 0.178 0.180 2000 0.376 0.369 0.373 1000 0.630 0.642 0.636 500 1.130 1.146 1.138 250 1.528 1.516 1.522 125 1.914 1.810 1.862 0 2.267 2.169 2.218 -
数据处理:
-
货期:3-5 working days
引用文献
- Synergistic effects of pro-biotics or post-biotics with n-3 highly unsaturated fatty acids on chronic mild stress-induced dyslipidemia in rats J Lee, Y Jin, Y Park,Research Square,2024
- The monomer of resveratrol butyrate ester ameliorates obesity and gut microbiota in high-fat diet rats YW Chen,Journal of Functional Foods,2024
- Body composition and metabolic consequences of antibiotics most frequently administered to newborns in intensive care units: an experimental study in healthy newborn rats E Segura,Frontiers in medicine,2024
- Ethanolic Extract of Orange Leaves Ameliorates Dyslipidemia in Streptozotocin-induced Diabetic Rats. N Dodantenna,/,2024
- Body Composition and Metabolic Consequences of Most Frequent Antibiotics Given to Newborns in Intensive Care Units, an Experimental Study in Newborn Rats C Wang,/,2024
- Alleviation of Limosilactobacillus reuteri in polycystic ovary syndrome protects against circadian dysrhythmia-induced dyslipidemia via capric acid and GALR1 signaling S Li,NPJ biofilms and microbiomes,2023
- Eicosapentaenoic acid and docosahexaenoic acid, but not α-linolenic acid, decreased LDL-cholesterol synergistically with estrogen via regulation of cholesterol synthesis and clearance in ovariectomized rats ChungPark, et al,Nutrition research,2019
- Palm Wine and Orijin Bitters Severed Hyperlipidemia and Immunomodulatory Responses in Atherogenic-diet Fed Male Wistar Rats Bukoye, Oyewo Emmanuel.et al,American Journal of Food Science and Health,2017
- Effect of n-3 PUFA supplementation at different EPA: DHA ratios on the spontaneously hypertensive obese rat model of the metabolic syndrome Molinar-Toribio E et al,Br J Nutr,2015
产品评价

相关产品
Most popular with customers
-
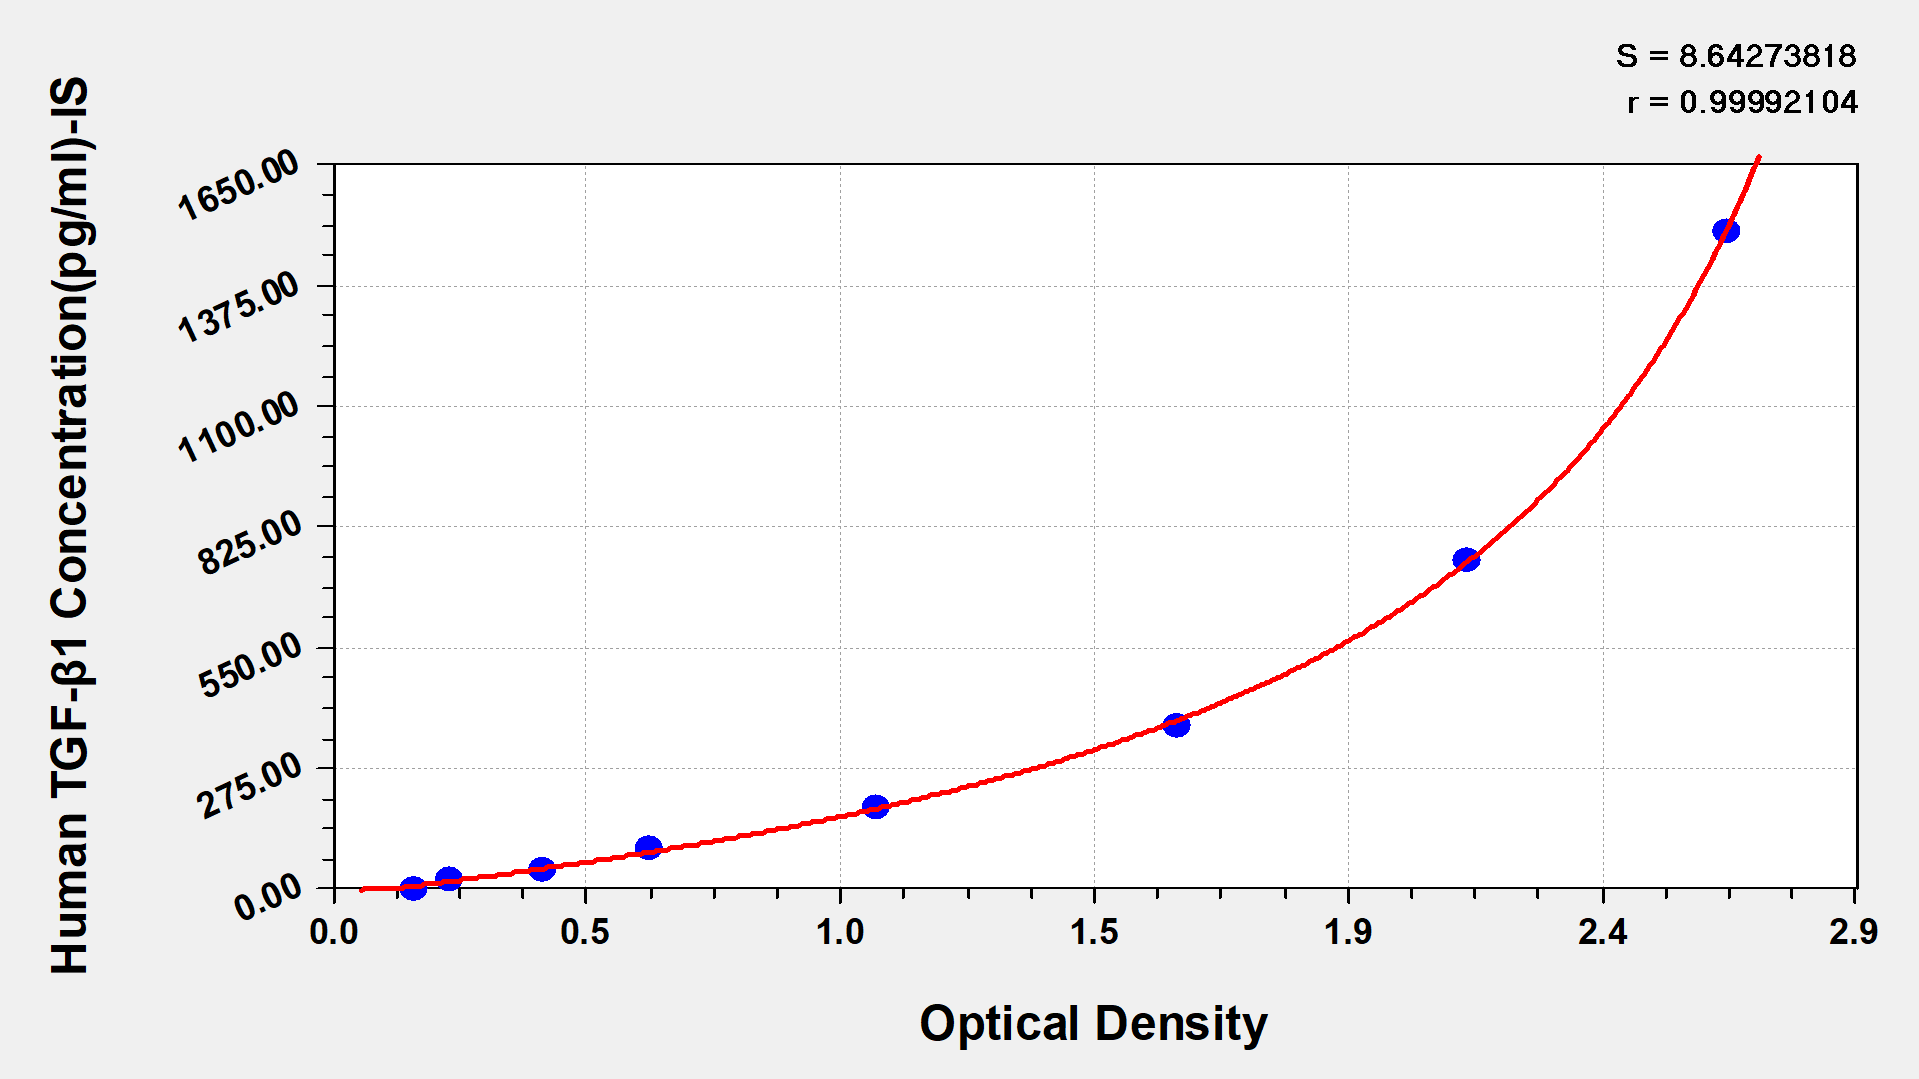
Human Transforming Growth factor β1,TGF-β1 ELISA kit
Detect Range: 23.5 pg/ml-1500 pg/ml
Sensitivity: 5.8 pg/ml
-
-
-
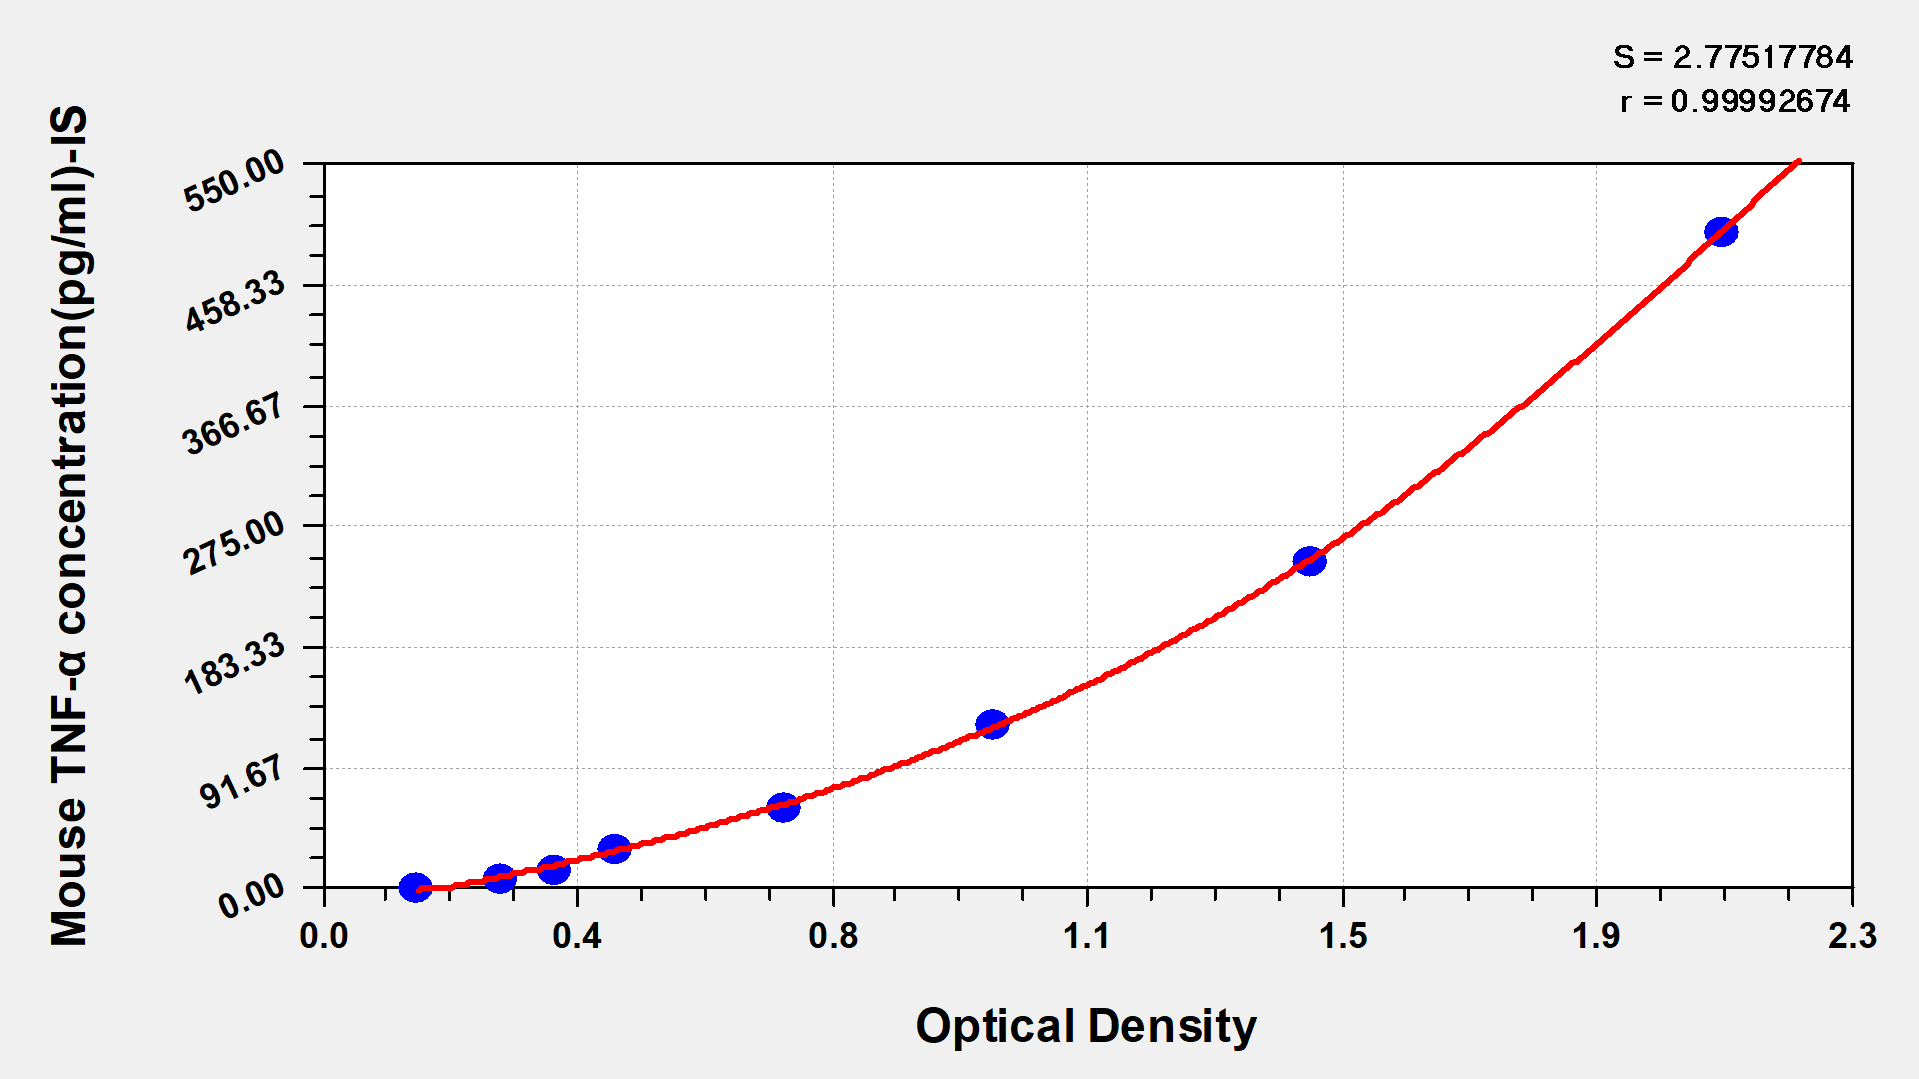
Mouse Tumor necrosis factor α,TNF-α ELISA Kit
Detect Range: 7.8 pg/ml-500 pg/ml
Sensitivity: 1.95 pg/ml
-
-
-

-